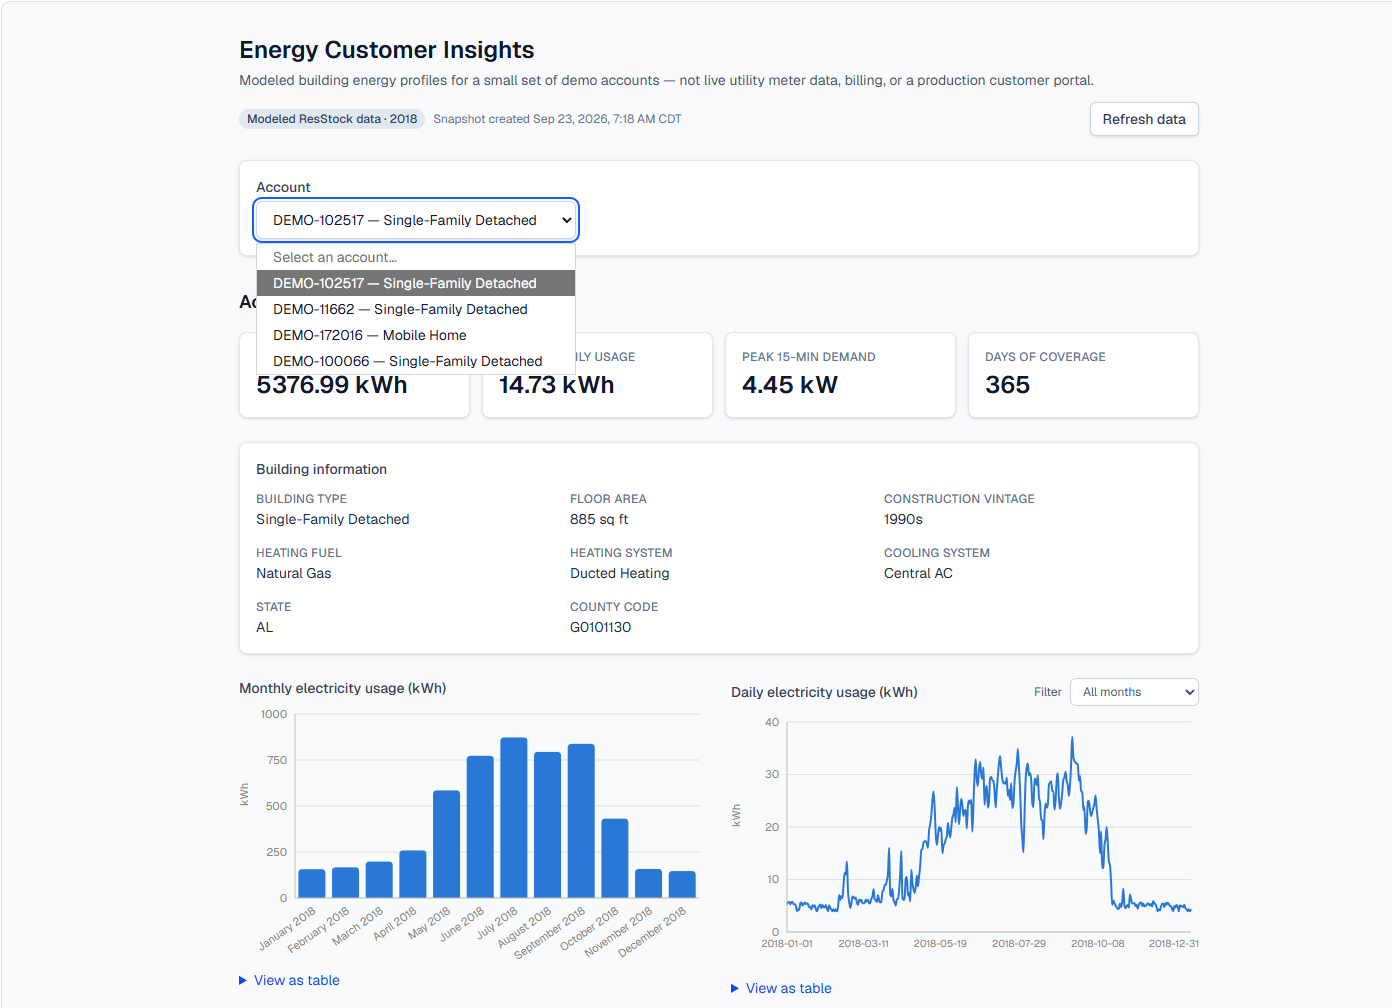
1. Dynamic account selection
New processed buildings can appear as new demo accounts in the selector without a frontend code change.
03 / ENERGY / DATA ENGINEERING
Explain electricity-usage changes through governed data, weather context, automated onboarding, and AI-assisted insight.
Working prototype · automated building onboarding validated
View public GitHub repository →Overview
Energy Customer Insights transforms modeled residential energy data into account-level analytics, month-over-month investigation, weather-aware context, and plain-language explanation. The analytics pipeline computes the facts; the LLM's job is to describe those already-computed results without inventing a cause.
A higher usage number does not explain whether the main driver was cooling, heating, seasonality, or a change in daily consumption. The application brings account context, trends, end-use composition, and aligned weather together before generating an explanation.
Built the AWS S3 ingestion pattern, scheduled Lambda transfer, Databricks Auto Loader and Bronze/Silver/Gold layers, automated building onboarding, weather enrichment, dynamic account creation, MLflow serving, frontend discovery, and evidence-constrained AI explanation workflow.
Architecture
The latest validation added a fourth building and confirmed that it flowed through S3 transfer, lakehouse processing, weather enrichment, Gold, snapshot refresh, live serving, and frontend discovery without manual application changes.
Application walkthrough
The account list is dynamic; the production frontend does not hardcode how many demo accounts exist.
New processed buildings can appear as new demo accounts in the selector without a frontend code change.
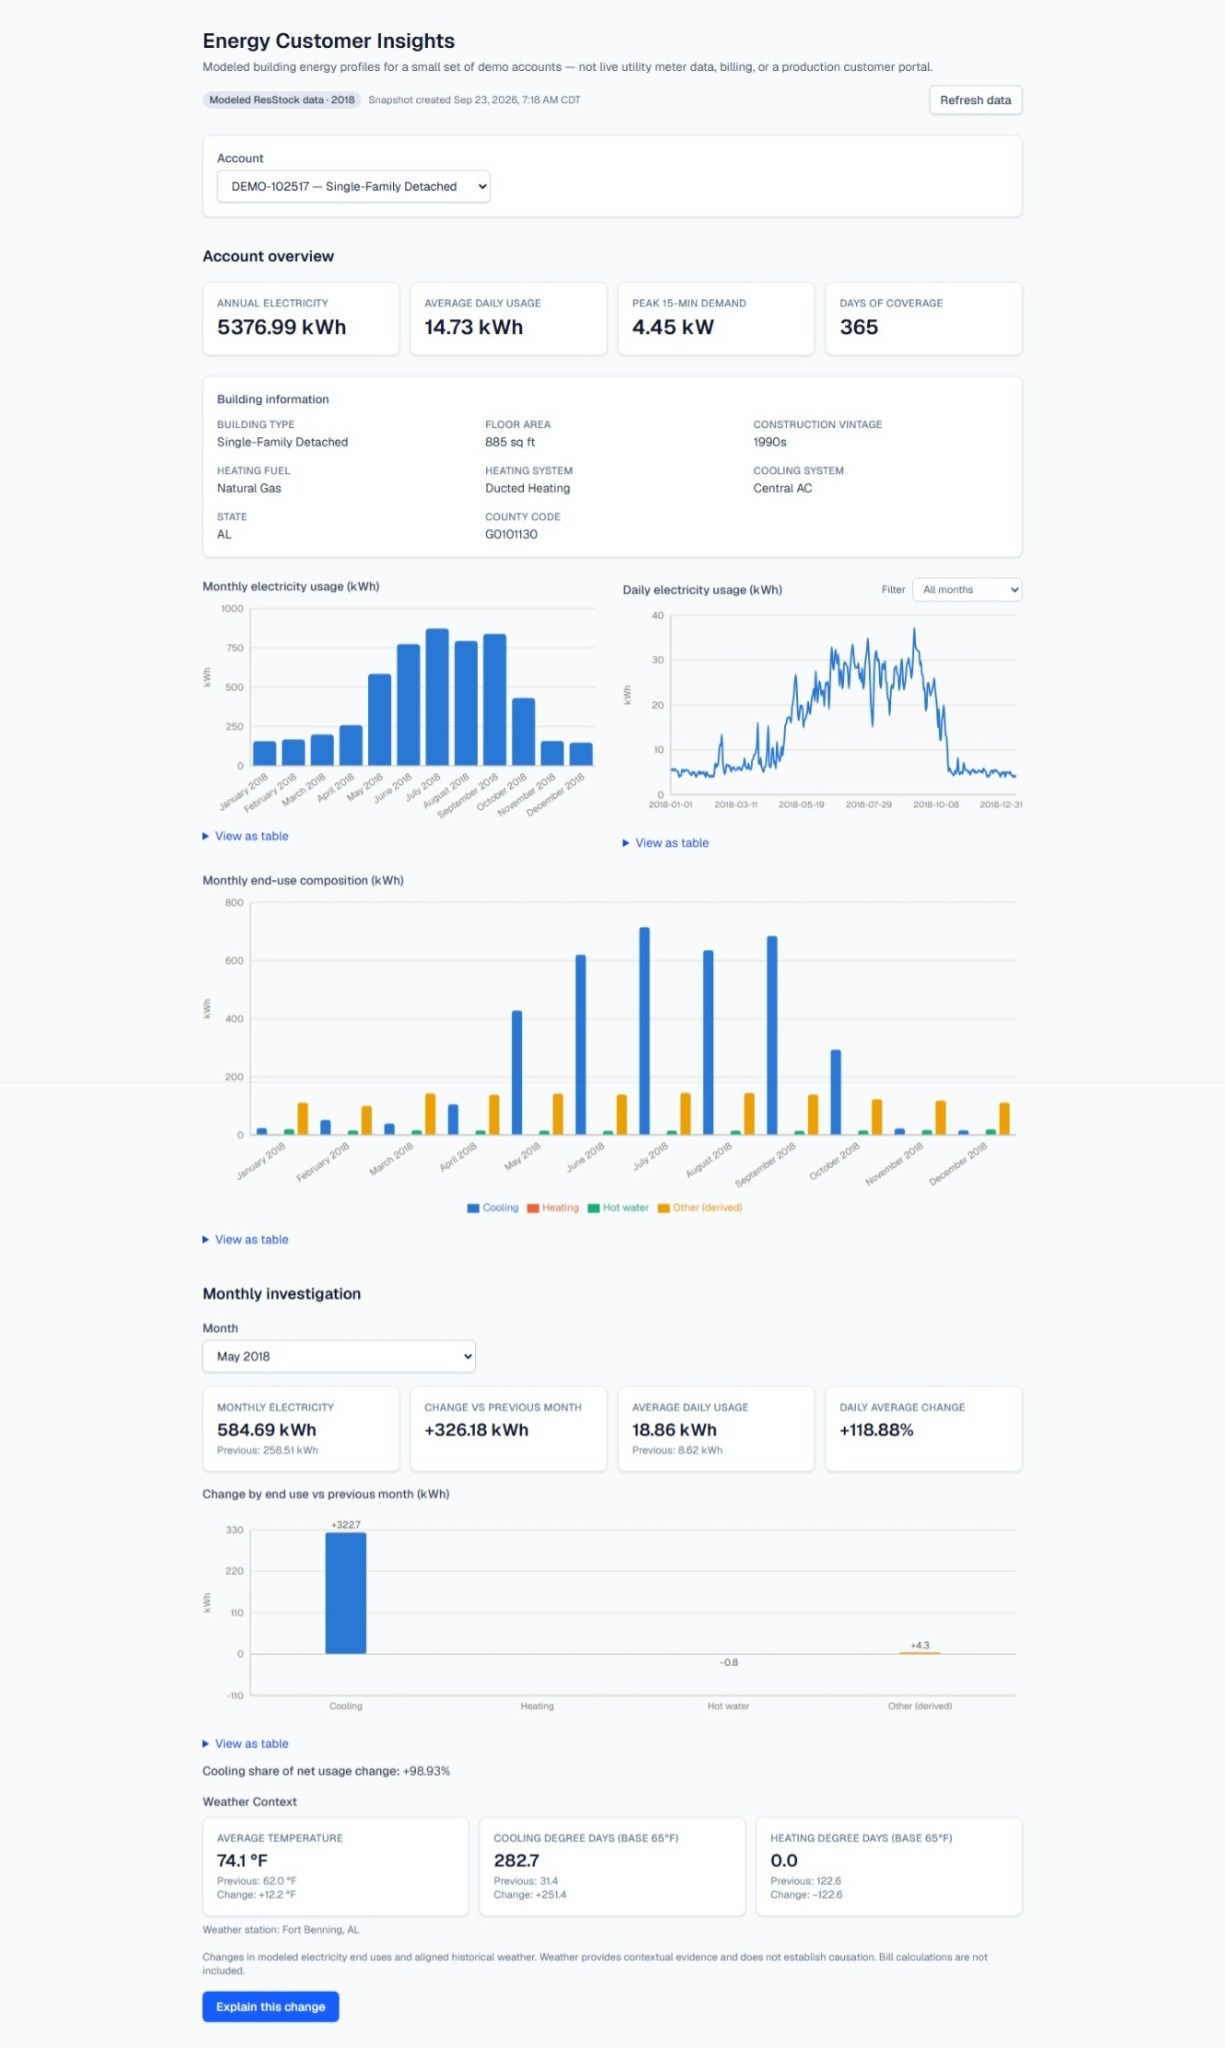
Annual usage, daily usage, peak demand, building context, monthly/daily charts, and end-use composition are presented together.
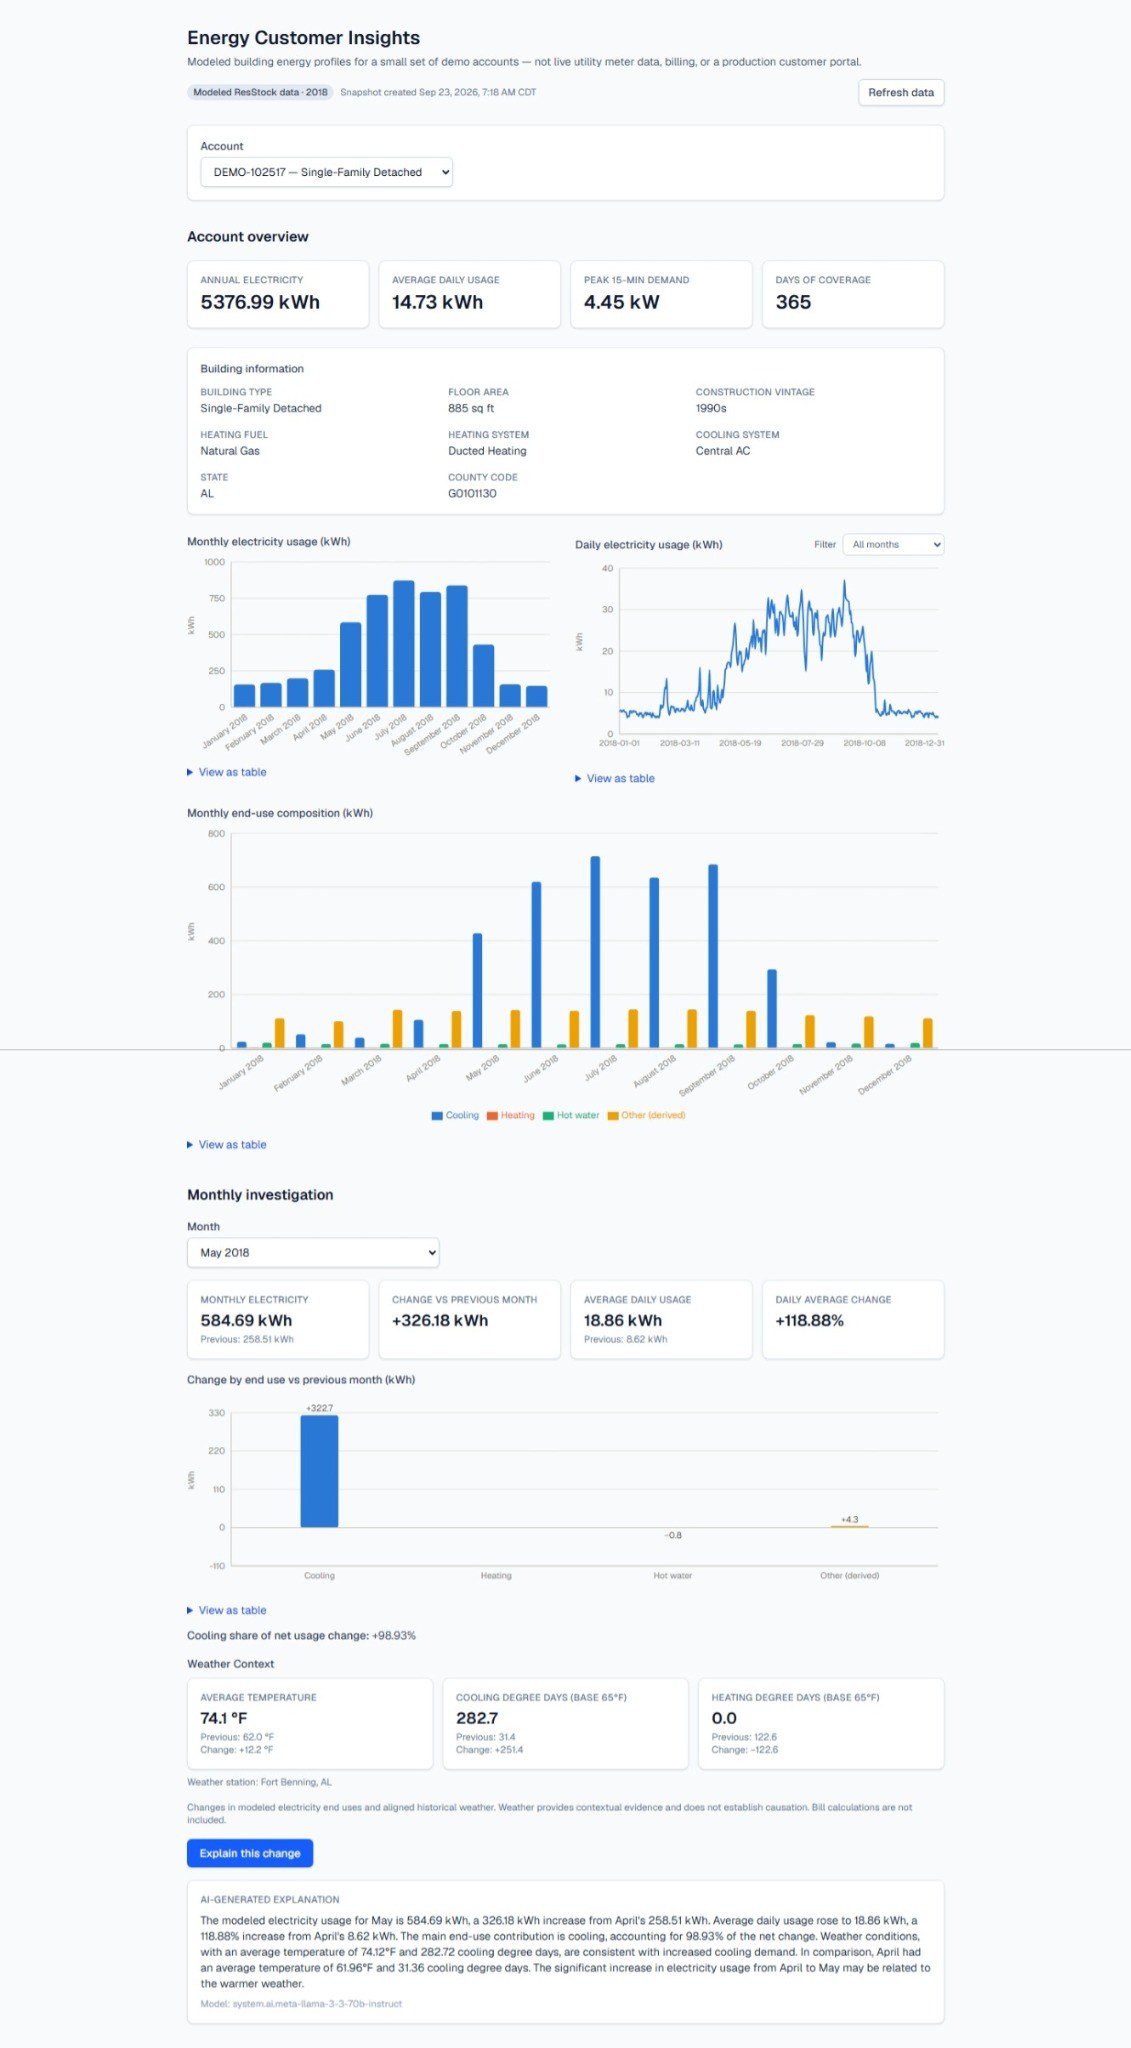
Month-over-month usage, end-use contribution, degree days, and temperature context are computed first; the explanation summarizes that evidence.
Key capabilities
Usage increased from 258.51 kWh in April to 584.69 kWh in May. The net increase was 326.18 kWh, average daily usage rose 118.88%, and 98.93% of the net increase was associated with cooling in the demonstration data.
Modeled ResStock demonstration data; not a production utility billing or customer-service system.